
The PT track: a DAUR analysis
School attractiveness, real selectivity, median level and the performance of PTSI/PT preparatory classes
Blog version • SCEI 2024 and Parcoursup 2025 data • 01/03/2026
Key points
In the SCEI 2024 sample used (programs open after PT), we count 1,667 enrollments across 172 programs.
Recruitment is highly concentrated: Arts et Métiers alone accounts for 545 enrollments (≈ 33% of the total), and the 10 largest recruiters for ≈ 53%. At the other end, the median program admits only 4 PT students.
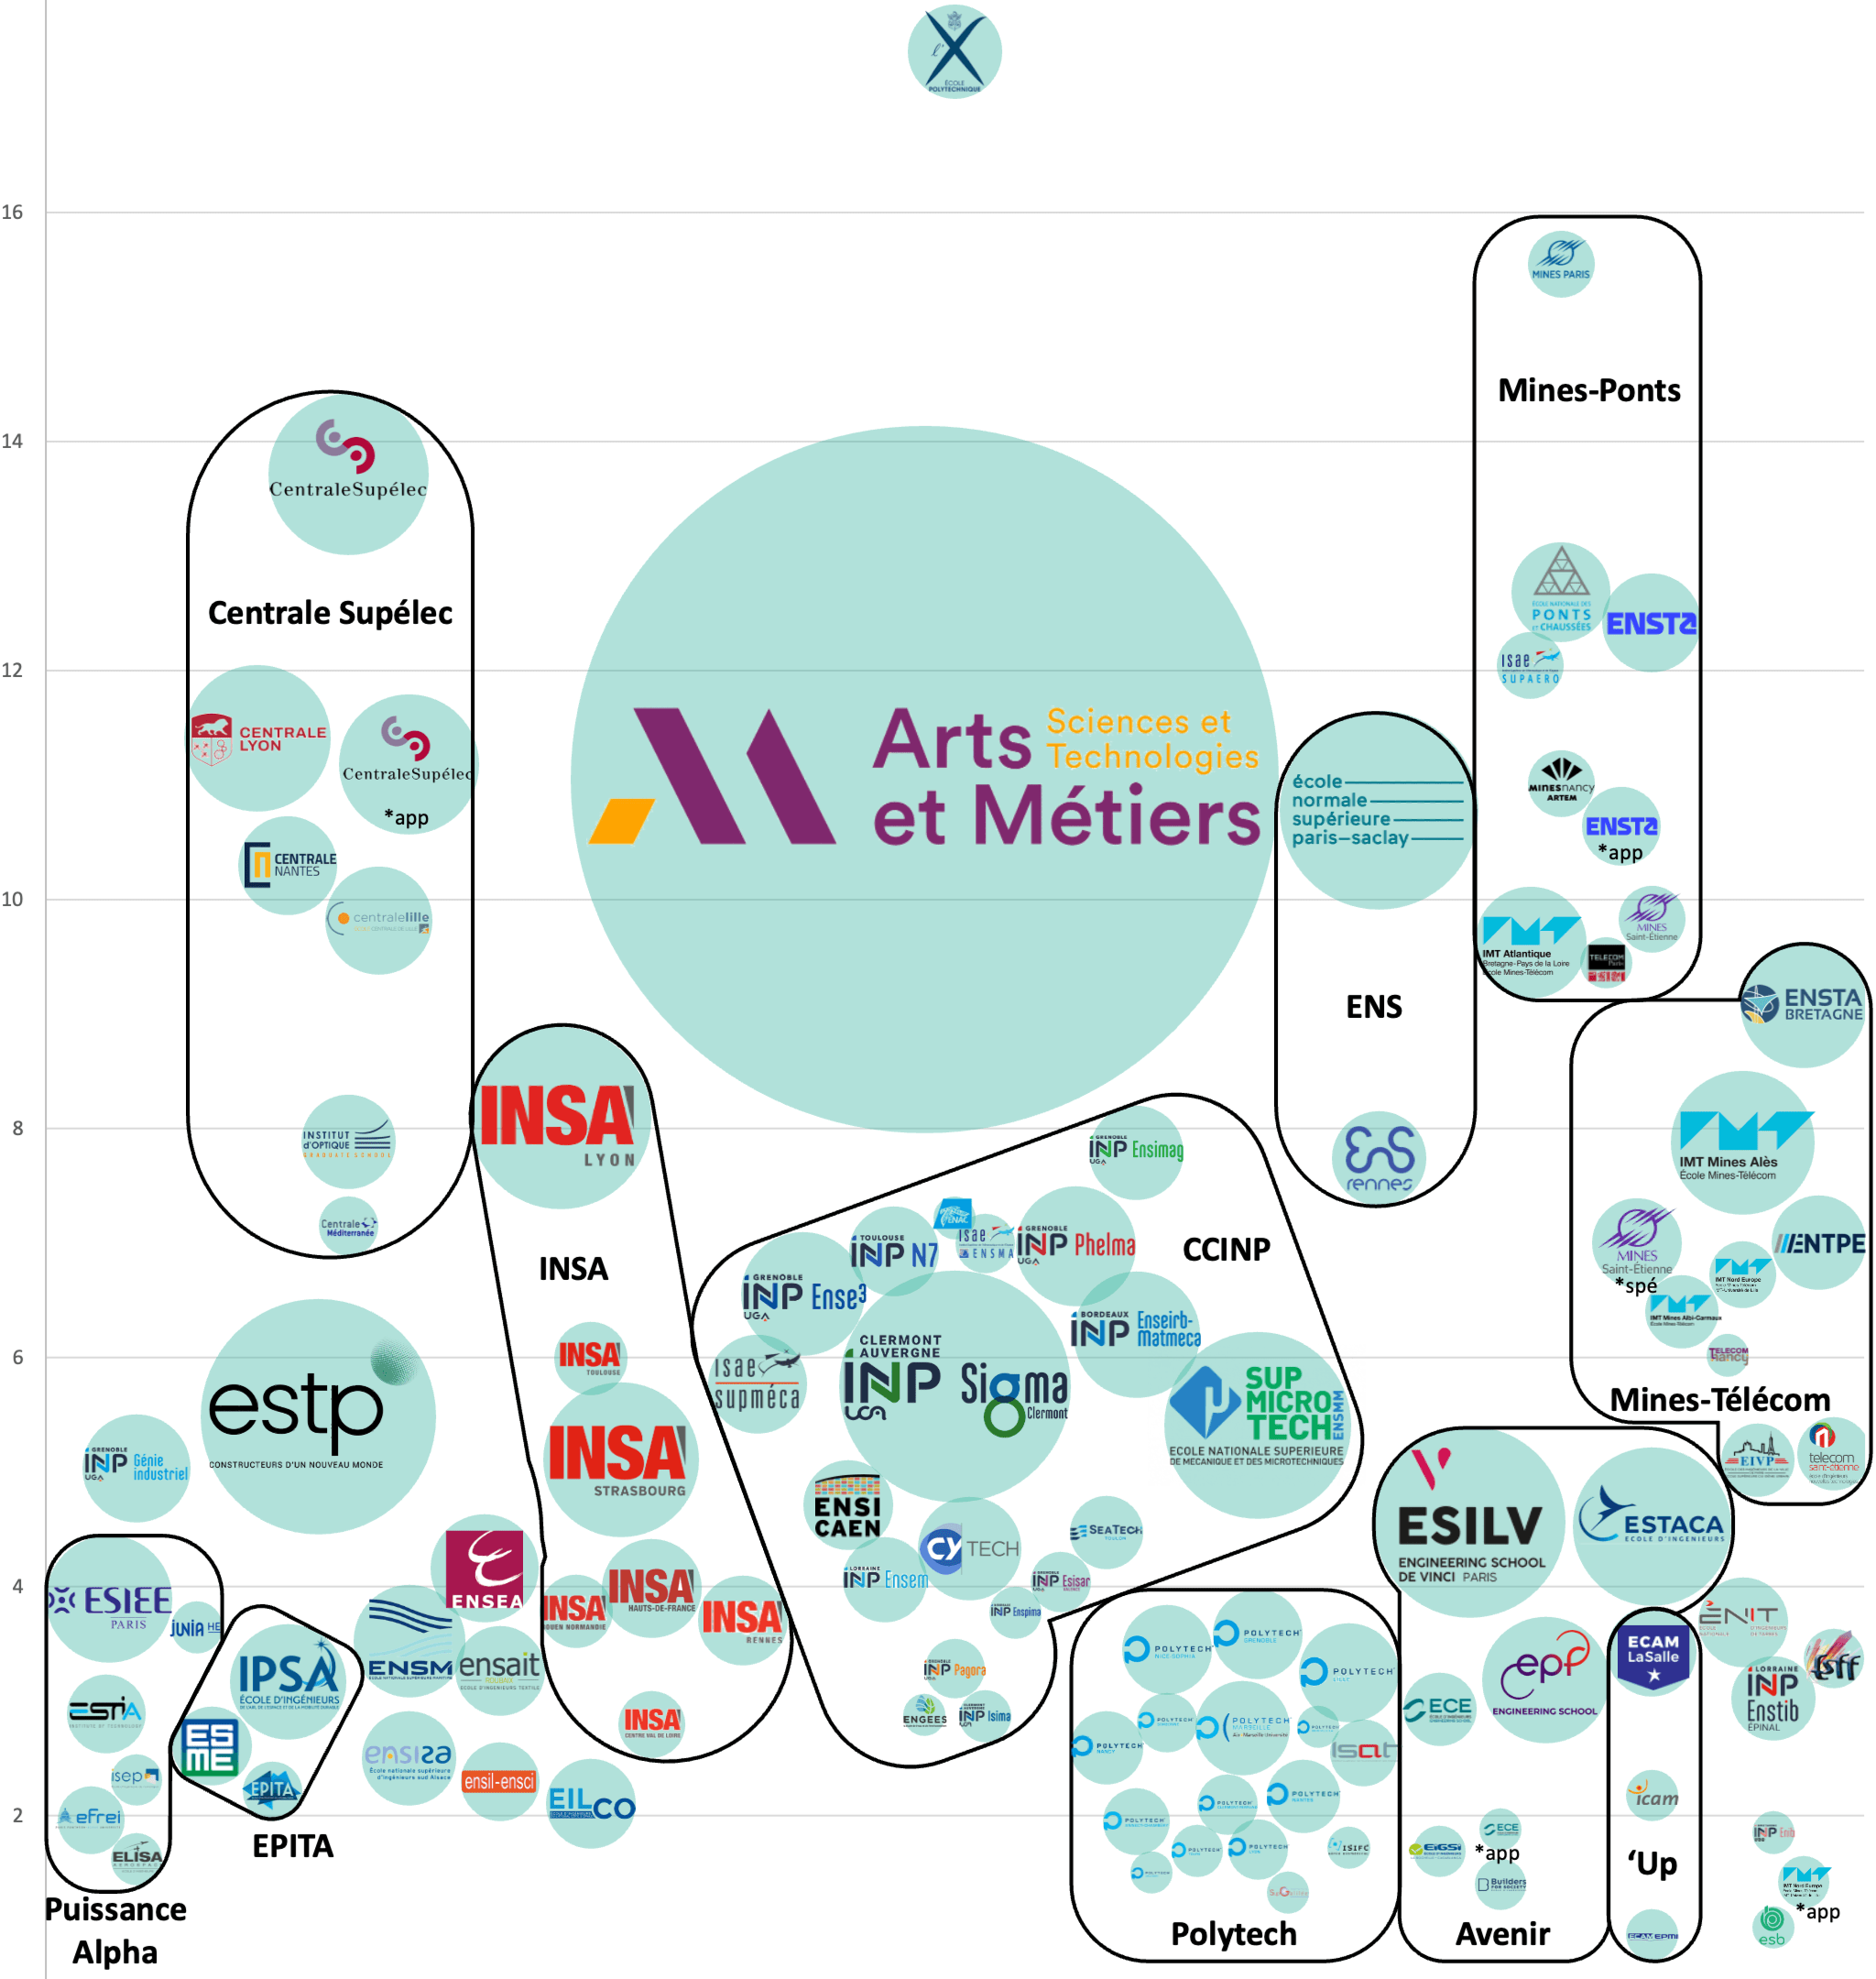
The attractiveness indicator (log-linear score) shows a very clear hierarchy of preferences: Polytechnique (13.4), MINES Paris (11.6), CentraleSupélec (9.7), Ponts (8.7), ENSTA Paris (8.4), ISAE-Supaéro (8.1)…
In a log-linear model, a gap of 1 point of attractiveness corresponds to a factor of e ≈ 2.7 in relative probability. As an order of magnitude, the gap between Polytechnique and CentraleSupélec (Δ≈3.7) corresponds to a factor of ≈ 40 in relative probability (all else being equal).
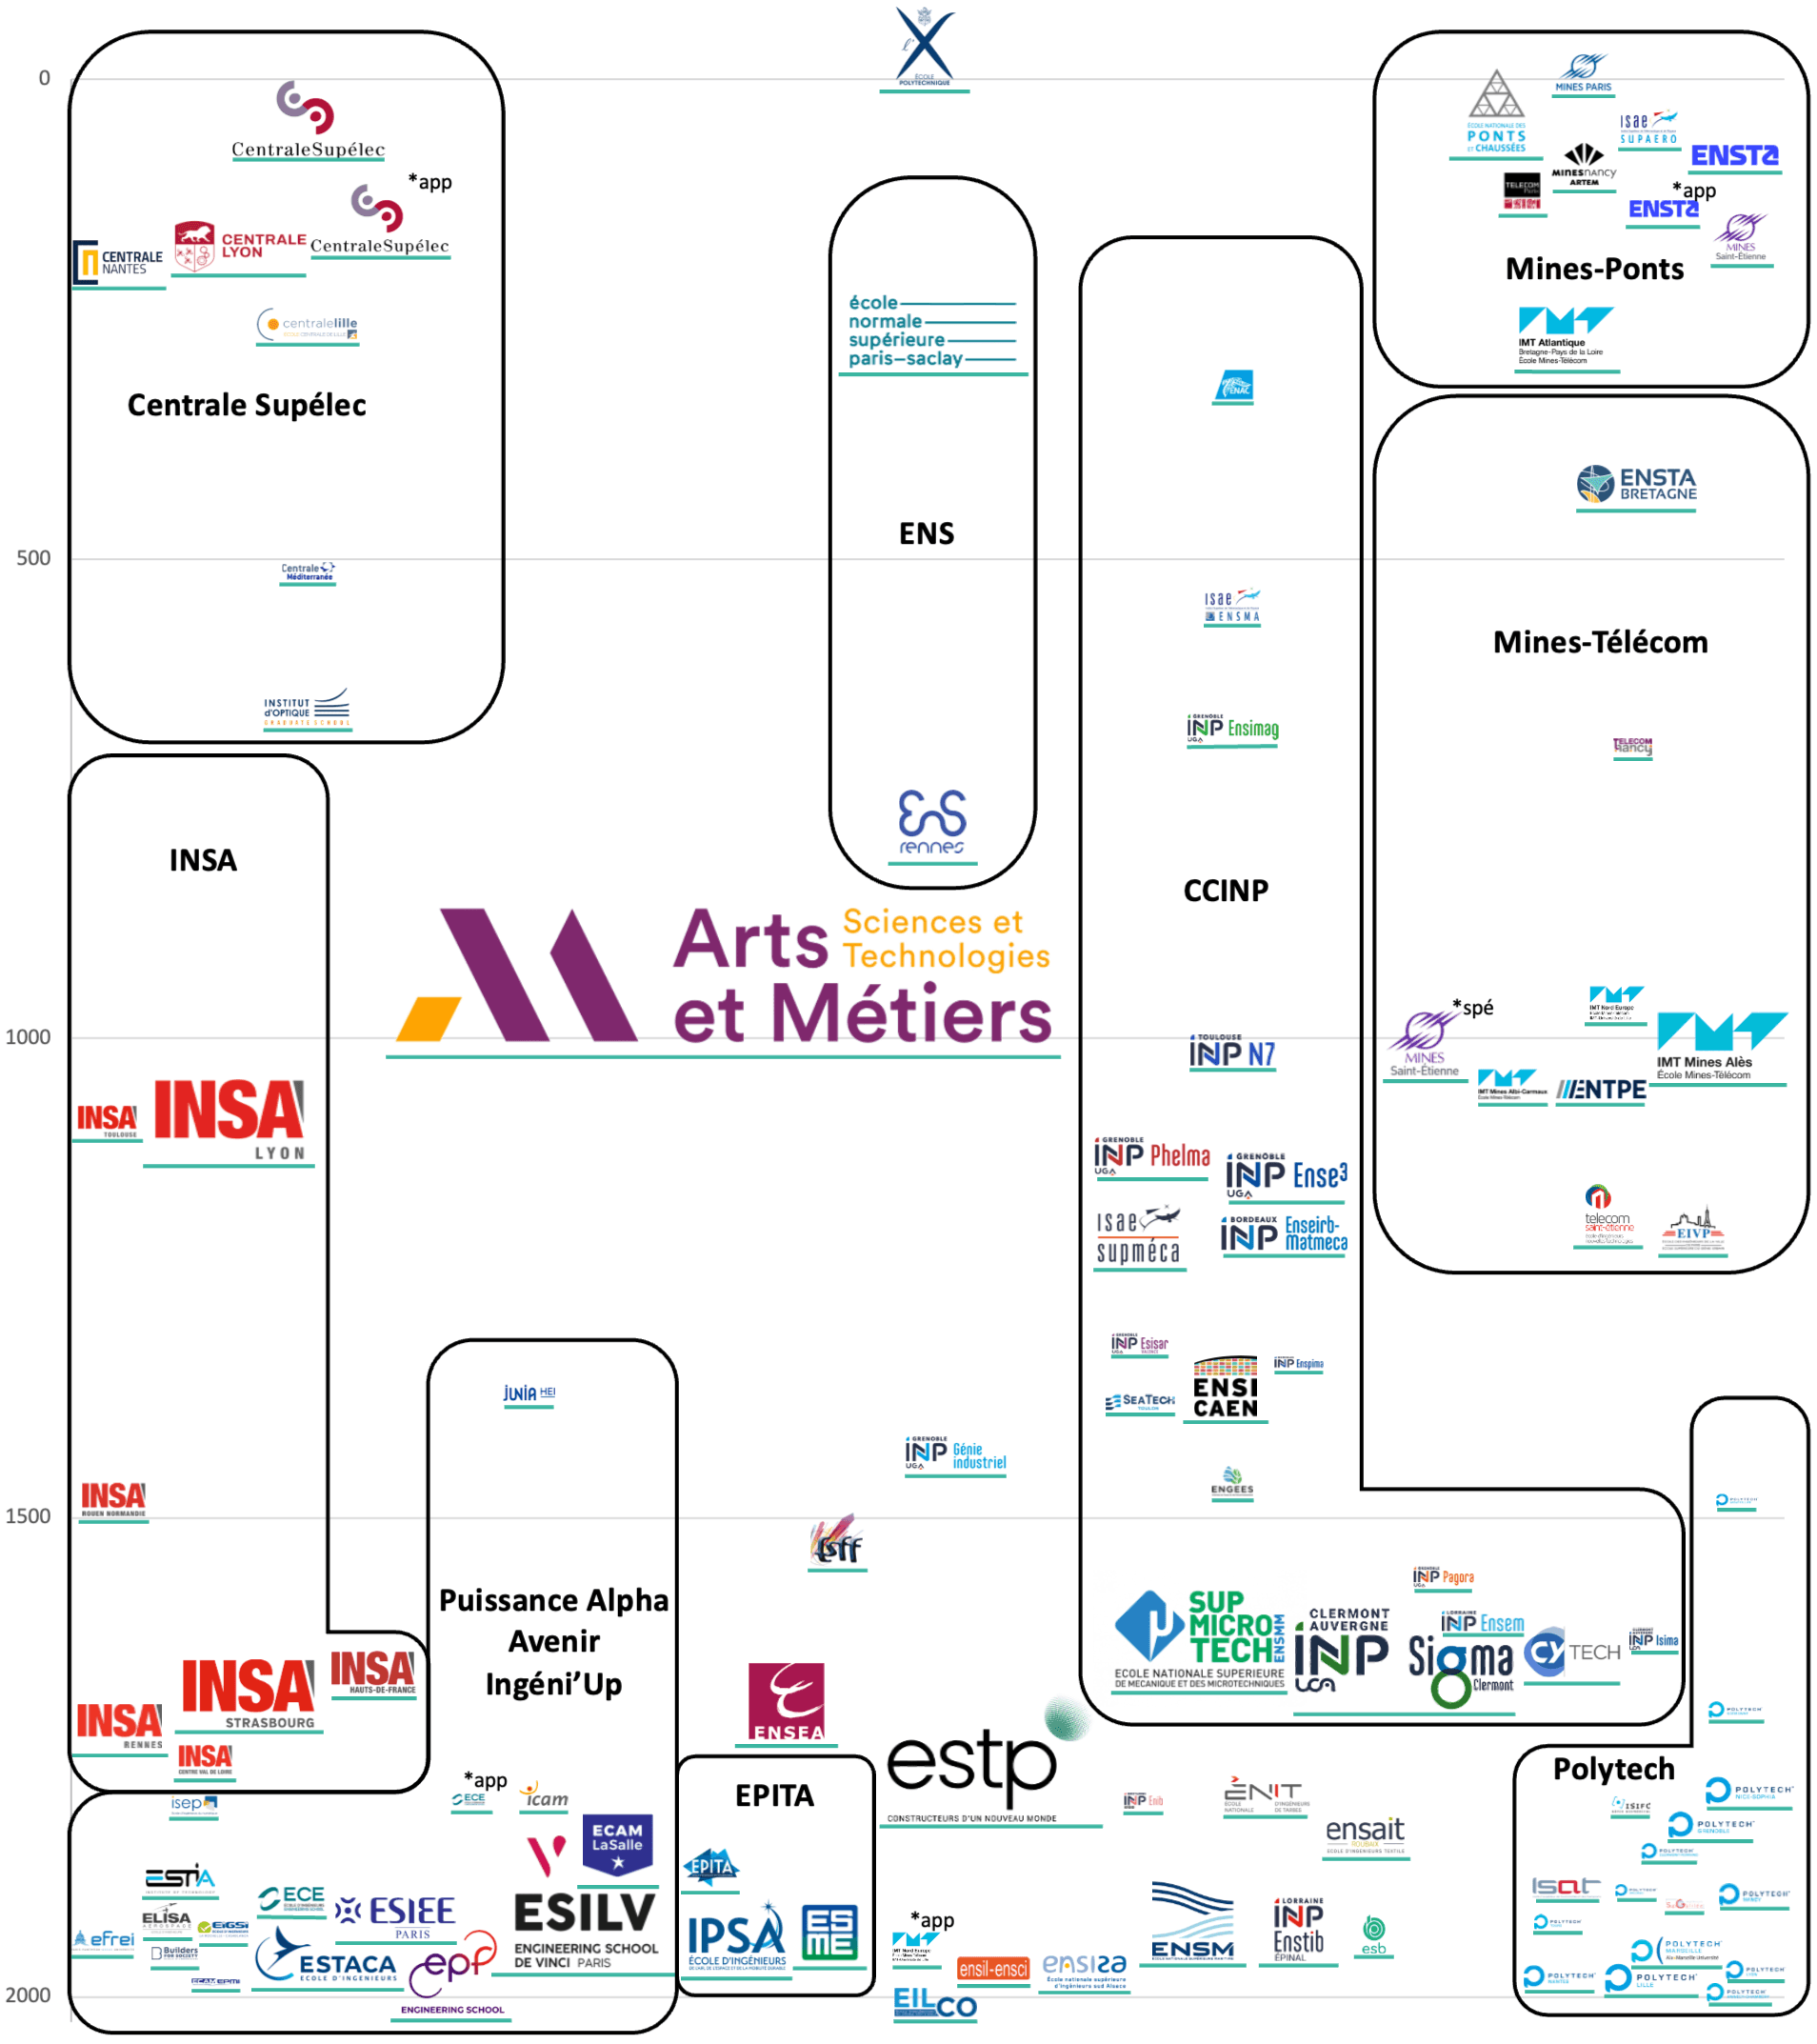
Recomputed selectivity (equivalent rank of the last admitted student) makes schools that recruit through different exams comparable: Polytechnique ≈12, MINES Paris ≈17, ISAE-Supaéro ≈73, Ponts ≈82, CentraleSupélec ≈83… while Arts et Métiers "closes" around rank ≈1,017.
At the CPGE level (PTSI), Parcoursup selectivity is strongly correlated with results at the end of prépa (correlation ≈ -0.71 in the sample). DAUR offers an assessment of the value added by each prépa, based on the relative gap between these two figures
1. Why analyze the PT track?
The PT track (PTSI → PT) holds a unique place among the preparatory classes: it combines a demanding scientific core with a technological culture that opens onto a very wide range of schools, from general engineering to very specific fields (civil engineering, aeronautics, mechatronics, computer science…).
This report aims to cover the PT track in depth: a set of students, a set of schools (and programs), and an assignment process in which preferences and the number of places determine both choices and admission cutoffs. This approach answers three core questions:
Which schools do PT students really prefer, all else being equal? (Attractiveness)
Which schools are really the hardest to get into, once the hierarchy of all the PT exams is "recomputed"? (Selectivity)
What is the median recruitment level of each program (recomputed median rank), and how does it read alongside the first two? (Median level)
We also go one level down, to the PTSI classes. From Parcoursup (selectivity at entry) and the schools' admission data (results at exit), we can approach a notion often invoked but rarely measured: the value added by a CPGE, meaning what it "produces" beyond what its initial intake would suggest.
2. Data and methodology
2.1 Sources and scope
This report relies on two main sources, used in the initial analysis document:
SCEI (2024): observed enrollments and assignments for programs open after a PT preparatory class. This data makes it possible to rebuild the attractiveness, selectivity and median level indicators. It was collected from some schools, exams and lycées and completed with public data;
Parcoursup (2025): access indicators for the PTSI classes (notably the admission offer rate by baccalauréat honors level), used here to measure how hard it is to get into each CPGE and to compare it with the SCEI results at exit.
Two methodological points matter:
The "schools after PT" analyses are shown at program level when relevant, since that is the most precise view (see Tableau_1). In the charts, some multi-program schools may be aggregated; any difference is a change of granularity, not an "error".
For the CPGE part, entry and exit are matched on consistent cohorts: the 2022 PTSI intake (entry) is compared with the 2024 PT results (exit) to cover a full cycle. It does not account for students who leave at the end of the first year (repeating, changing track or changing lycée) or, conversely, for students who join in the second year (outside Parcoursup).
2.2 DAUR's three indicators: attractiveness, selectivity, median level
The three indicators used here cover three complementary dimensions. Reading them together avoids common misreadings (for example, confusing volume with prestige, or exam cutoffs with how hard a school really is to get into).
Attractiveness
Attractiveness is a log-linear view of student preference: the gap between two schools reflects the probability that a student who has the choice picks one over the other.
In practice: if school A's attractiveness score is Δ higher than school B's, the model implies that the relative odds of choosing A over B are multiplied by exp(Δ). A 1-point gap therefore corresponds to a factor of exp(1) ≈ 2.7, a 2-point gap to exp(2) ≈ 7.4 and a 3-point gap to exp(3) ≈ 20.
Selectivity
Selectivity measures the equivalent rank of the last admitted student within the track, not within a specific exam. The goal is to compare schools that recruit through different exams by placing them on the same scale of PT ranks.
In practice, instead of looking at a cutoff in one exam, we estimate at which "overall PT" rank the school stops admitting. A school that closes at rank 100 is more selective than one that closes at rank 1,000, even if they do not recruit through the same exam.
Median level
The median level (in the table: median rank) gives a benchmark for a program's "average" recruitment level, rebuilt across the whole exam with the same algorithm as selectivity.
It complements selectivity: two schools can close at similar ranks but recruit different median profiles, especially if their admitted students are more or less spread out.
It is the best indicator for comparing the relative level of schools.
2.3 The recomputation algorithm: from observed choices to an equivalent rank
The selectivity and median level indicators rely on a statistical assignment algorithm:
We consider a theoretical ranking of all the students in the track.
We go from the first student to the last, assigning each one a school based on (i) the exams they sat, (ii) the schools that still have places and (iii) the relative attractiveness of the schools open to them.
The process also allows for students repeating the year or dropping out.
Once assignment is complete and every program is full, selectivity is the rank of the last admitted student in this ranking.
The algorithm is run 50 times and averaged to stabilize the results.
2.4 Limits and caveats
Like any statistical analysis, this one should be read with care. Three points matter most:
Small numbers: many programs admit only 1 to 3 PT students. Their scores are more volatile (one individual choice can move the estimate a lot).
SCEI scope: some admissions outside SCEI (on application, specific routes) are not always comparable. In the table, the ENS statistics include foreign candidates and admissions on application.
Relative reading: attractiveness is a relative preference score. A negative score does not mean a program is "bad", only that it is chosen less often than the alternatives observed in this specific market. A specialized program can therefore be expected to score lower than a general one.
3. Mapping the programs open after PT
3.1 Market size and concentration: a hard core and a long tail
The analysis counts 2,026 ranked students for 1,667 PT enrollments (because of students repeating the year and enrollments outside SCEI, e.g. the ECAM LaSalle prépa, UTC admission on application, IMT work-study, etc.) across 172 programs. Volumes are extremely skewed:
Half the programs (the median) admit 4 PT students or fewer; counted by school, the median is 8 students
Arts et Métiers admits 545 students on the regular track and 560 including the IMI and apprentices, a third of all observed enrollments.
The 10 largest recruiters account for 57% of enrollments: Arts et Métiers (560), ESTP (62), Clermont Auvergne INP-Sigma (60), CentraleSupélec (51), ENS Paris-Saclay (44), ESILV (41), SupMicrotech-ENSMM (39), INSA Lyon (37), ESTACA (28), INSA Strasbourg (27)
This concentration shapes the track. Part of the "PT reality" plays out in a small number of very large programs, while many programs take very few students (often 1 to 3), which makes them noisier to read.
3.2 Attractiveness: the hierarchy of preferences
Attractiveness measures revealed preference: what students choose when several options are open. What matters most is not the absolute level but the gaps, which show how strong the preference is.
Three lessons stand out right away:
A very clear ceiling: Polytechnique (13.4) and MINES Paris (11.6) form a summit well ahead of the rest.
A leading pack of highly sought-after schools: CentraleSupélec, Ponts, ENSTA Paris, ISAE-Supaéro, then the Centrales and the Mines.
A PT-specific feature: a very attractive mass recruiter, Arts et Métiers (7.0), which combines volume and preference.
Évaluation de l’attractivité des formations accessibles après CPGE PT
Note: the exp(Δ) reading gives a sense of how large the gaps are. For example, the gap between Polytechnique (13.4) and CentraleSupélec (9.7) is Δ≈3.7, a factor of ≈40 in relative probability in this model. This does not mean a student is 40 times more likely to enter Polytechnique (the number of places is very different), but that when choosing between these two options, revealed preference is extremely lopsided.
Apprenticeship routes also show up clearly: CentraleSupélec (apprenticeship) keeps a high attractiveness score (7.2), but below the regular route (9.7). ENSTA Paris and Télécom Paris follow a similar pattern. This reflects preferences split by status, teaching and career plans more than a one-dimensional hierarchy.
3.3 Selectivity: who closes early and who takes in the bulk?
Recomputed selectivity compares all programs on the same rank scale. It captures the balance of supply and demand: a school can be very attractive but not very selective if it has many places; conversely, a school with few places can be very selective even with a small volume.
Évaluation de la sélectivité des formations accessibles après CPGE PT
A few reference points (program sample):
Top 10% most selective programs: rank of the last admitted student ≲ 304.
Top 25%: rank of the last admitted student ≲ 1,064.
Median: rank of the last admitted student ≈ 1,566 (in other words, half the programs close after about 1,500 ranks).
The top is extremely short: Polytechnique (~12) and MINES Paris (~17) close almost at once, consistent with very few places and a very strong preference. By contrast, very large schools such as Arts et Métiers close much later (~1,017) while staying attractive, the signature of a mass recruiter.
3.4 Median level: what is the average quality of recruitment?
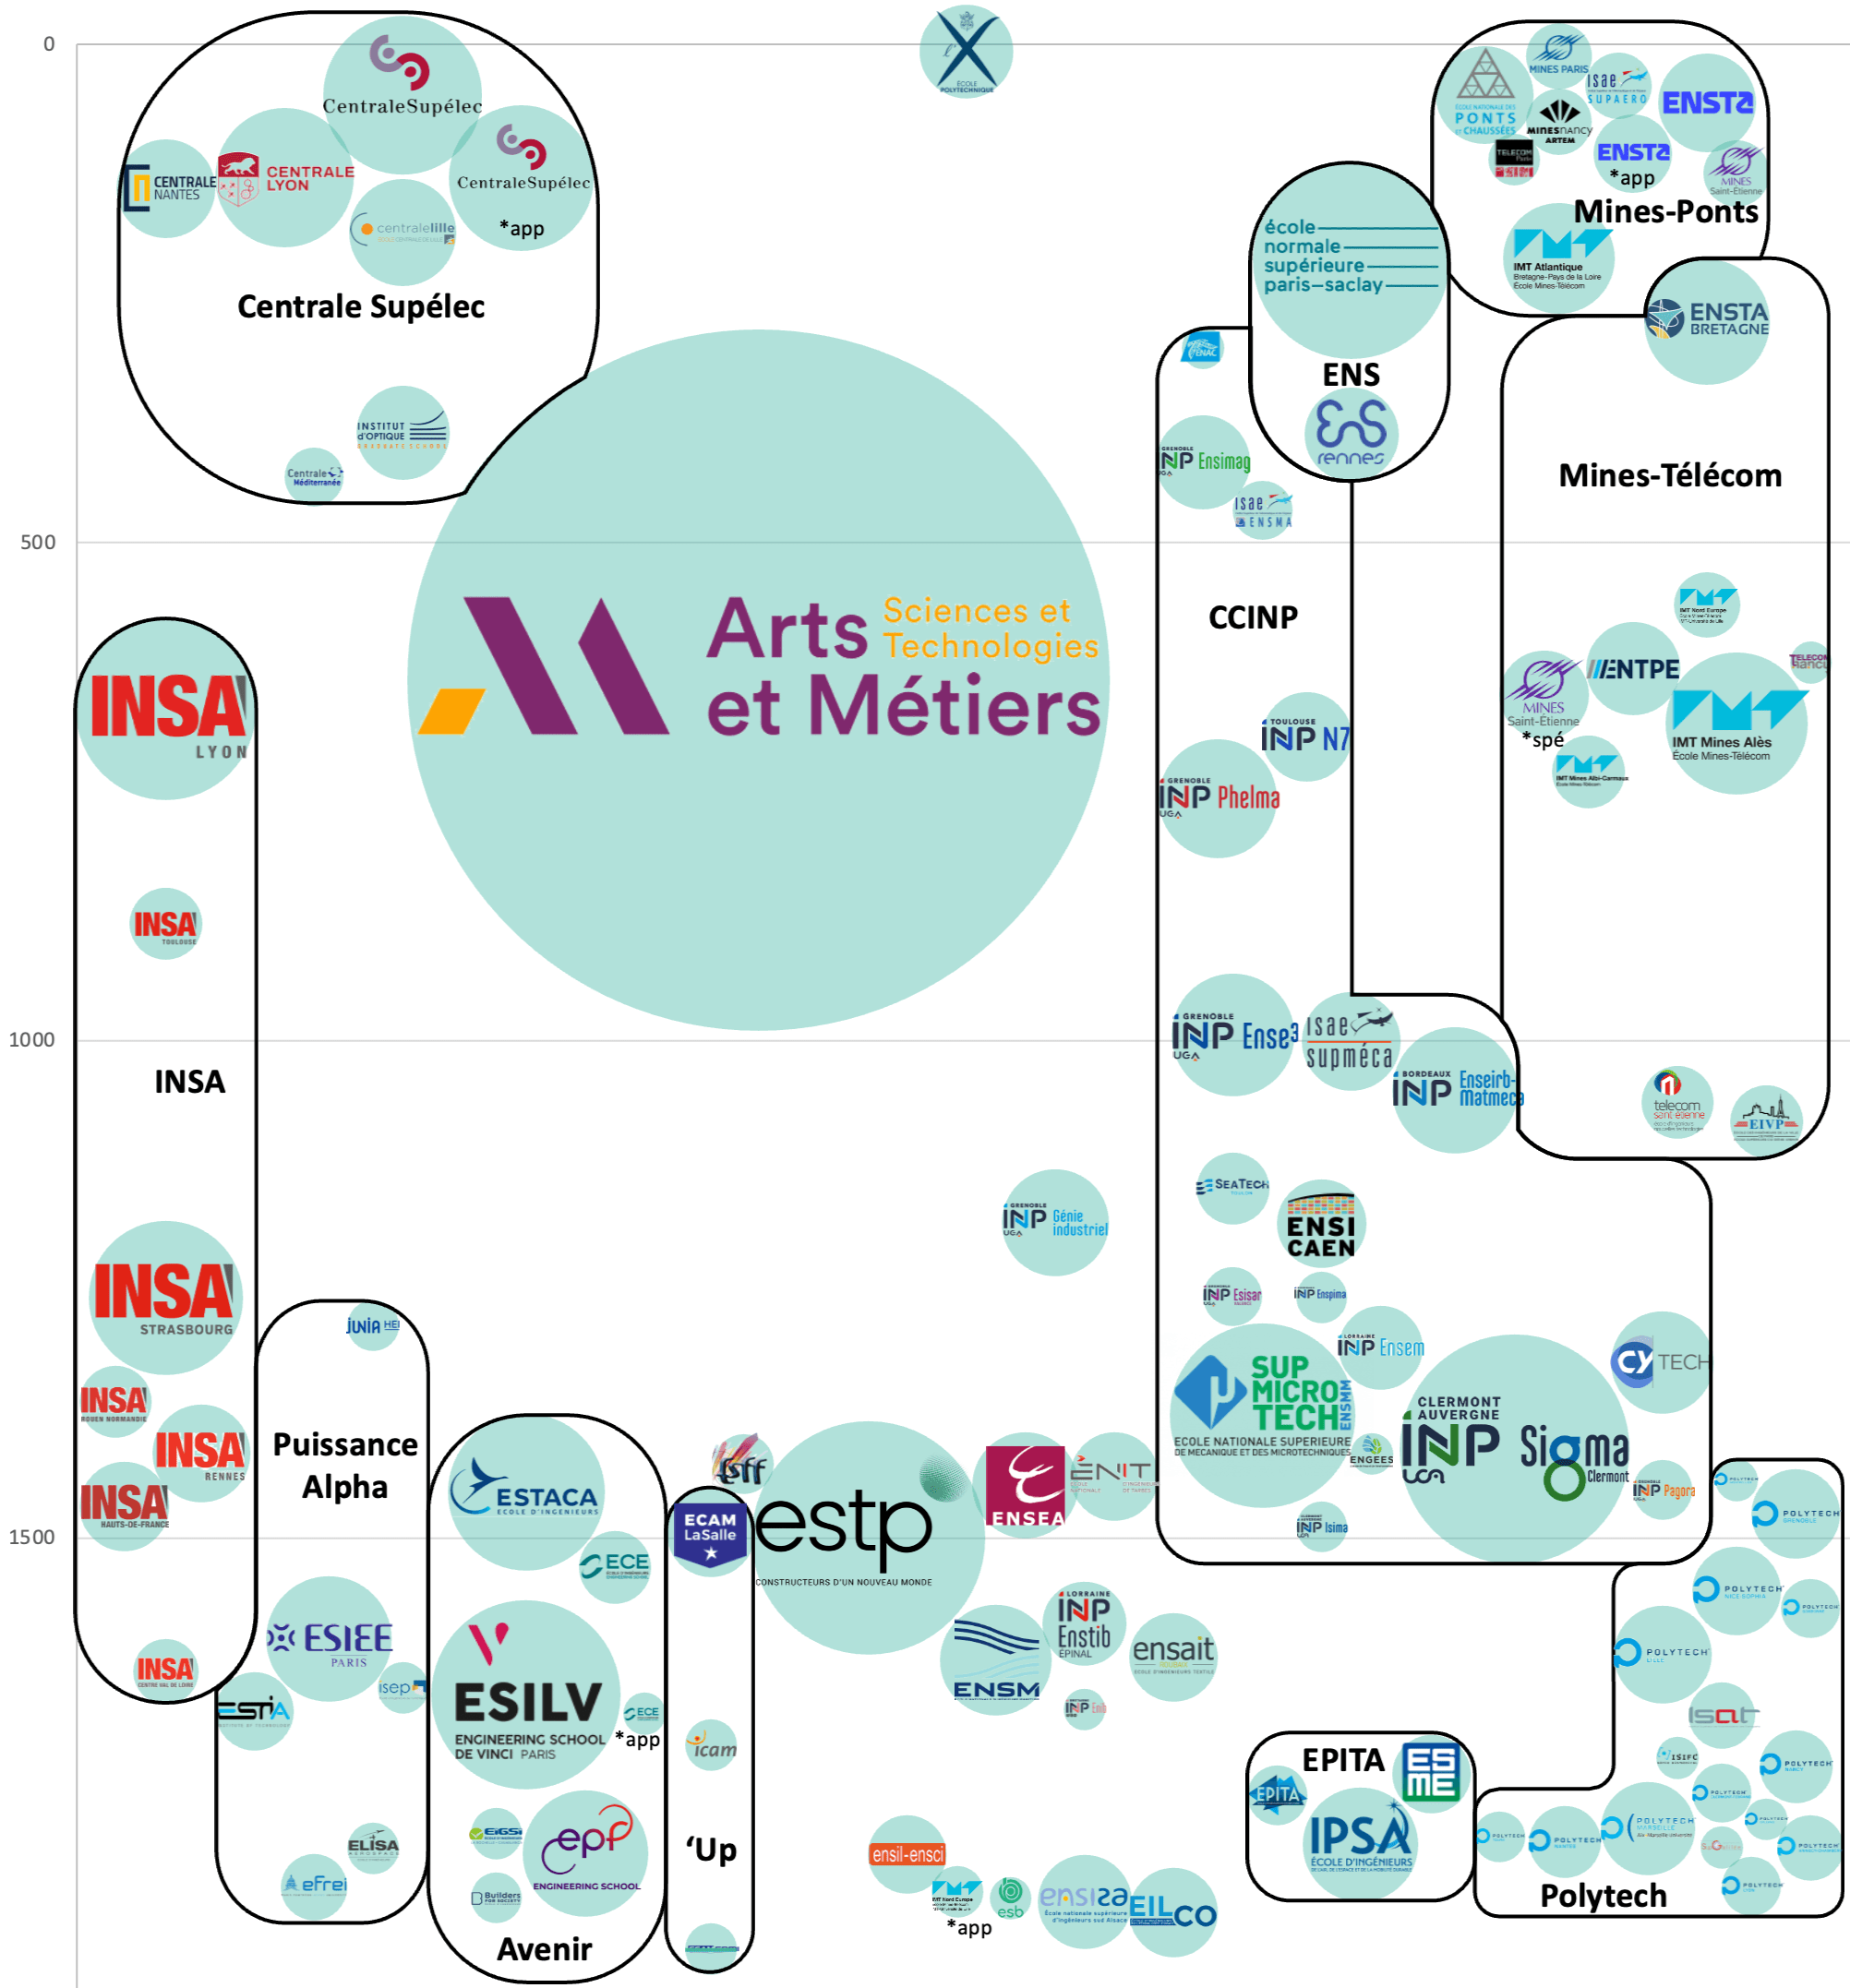
The median level complements selectivity by giving the median rank of admitted students. Two schools can close at similar ranks, but one can have a higher median if its admitted students are more concentrated at the top of the ranking.
Évaluation du niveau moyen des formations accessibles après CPGE PT
In the data, the three indicators are very consistent: attractiveness and selectivity are strongly correlated (≈ -0.91), and selectivity and median rank even more so (≈ 0.98). This is reassuring, since it suggests the algorithm rebuilds a stable hierarchy. The analysis becomes most interesting, though, in the gaps, the cases that do not quite follow the correlation.
3.5 Reading them together: four segments and the real surprises
To read the track without getting lost in 170+ rows, it helps to think in segments. A simple segmentation consistent with the three indicators shows four zones:
Segment A, the very top: very high attractiveness and very low closing ranks (a few dozen). Examples: Polytechnique, Mines Paris, Ponts, CentraleSupélec, ENSTA, ISAE-Supaéro.
Segment B, the high-level core: high attractiveness, closing within the first few hundred ranks. Examples: the Centrales (Lyon, Nantes, Lille…), the Mines (Nancy, Saint-Étienne…), Télécom, ENS Paris-Saclay…
Segment C, the industrial base and large specialized schools: moderate attractiveness but large volumes, closing later. Examples: Arts et Métiers, ESTP, SIGMA, SupMicroTech, some INSA, IMT schools…
Segment D, the long tail: small volumes (often 1 to 3 enrollments), lower attractiveness and late closing. The reading there is noisier and calls for caution.
Among the surprises that shape the track:
The central role of Arts et Métiers: huge volume, high attractiveness and still meaningful selectivity (closing at 1,017 on a scale that goes beyond 2,000).
Apprenticeship routes form their own segment: they stay attractive but shift the thresholds (selectivity and median) compared with the regular routes.
The weight of the core: many choices are made between very solid schools within a few hundred ranks of each other, far more than at the very narrow top.
To go beyond commentary, the best practice is to read the combination (attractiveness, selectivity, median level) while keeping volume in mind. An attractive score for a very large program does not mean the same thing as for a program with 1 place: the first reflects mass preference, the second concentrated prestige.
4. Focus on PTSI preparatory classes: selectivity at entry, results at exit, value added
4.1 Parcoursup selectivity: a very fragmented picture
The CPGE table lists 69 PTSI classes, 60 of which have a usable 2025 Parcoursup selectivity indicator. The variable used here is the admission offer rate: the lower it is, the more selective the access.
The picture is very fragmented: selectivity ranges from about 8% (very selective) to 95% (much more accessible). The table groups the PTSI classes into tiers (Elite, National, Regional, Departmental, Local) that correspond to ranges of offer rates.
Elite: 1 PTSI, offer rate <10%,
National: 3 PTSI, median offer rate <20%,
Regional: 9 PTSI, median offer rate <40%,
Departmental: 14 PTSI, median offer rate <70%,
Local: 33 PTSI, offer rate above that,
This access gradient matters because it largely shapes the academic makeup of the incoming class. A CPGE that is very selective at entry starts, on average, with stronger students. The question is then what the CPGE does with them.
4.2 Results at exit: entry strongly predicts exit, but not entirely
The table gives a success score (exit) based on exam results. Without going into the scoring details, it can be used robustly to compare CPGE classes on the same yardstick and to relate performance to selectivity at entry.
In the sample, the correlation between the Parcoursup offer rate and the success score is 0.71 (negative). This is expected: the more selective a PTSI (low rate), the higher its exit score tends to be.
This finding sets a baseline. If we stopped here, we would conclude that "the best CPGE is simply the one that recruits the best students". A DAUR analysis aims to go further.
The top success scores belong to very selective CPGE classes (for example Sainte-Geneviève, Passy Buzenval, Jean-Baptiste Say), which shows the power of the entry factor. The very existence of a value-added score (next section), however, shows there is a second dimension: what the class does with its students.
4.3 Value added: the CPGE classes that make the biggest difference
Value added compares what a class produces at exit with what its selectivity at entry would suggest. It is the most useful indicator for a student choosing between PTSI classes with different entry levels, or for a CPGE that wants to measure its teaching impact objectively.
In the sample, the correlation between selectivity at entry and value added is weak (≈ 0.10). Some CPGE classes are very accessible at entry and yet make a big difference.
Full table in the appendix
What these classes have in common is striking: several schools in the Local or Departmental tiers (so relatively accessible at entry) show value added above 2. They clearly outperform what their initial intake would predict.
4.4 How to use these results (students, families, schools)
For a candidate, these indicators answer different questions:
If you want a very selective environment at entry and a very uniform class, look first at the Parcoursup selectivity tier.
If you want the CPGE where you are most likely to progress, look first at value added.
If you want to minimize risk and maximize the chances of good admissions on average, look at results at exit (keeping the entry level in mind).
For a CPGE, value added can feed an internal review (teaching, support, policy on repeating the year) without falling into raw performance comparisons, which automatically favor the classes that are most selective at entry.
For a DAUR reader, combining the two views is the most useful. There is no ideal one-size-fits-all answer, but it is best to choose a CPGE suited to your post-bac level, so as not to fall behind in a prépa that may expect knowledge beyond the curriculum or, conversely, to coast through a class that does not push you enough.
Appendix 1: table by program
Tableau admissions post CPGE PT
Appendix 2: table by CPGE
Tableau CPGE PTSI PT