

Every summer, admission lists rain down on lycée courtyards like confetti: Polytechnique, ENS, Mines, the veterinary schools, Saint-Cyr… so many flags planted on the mental map of prépa students. Behind the podiums lies a question that often gets skipped: what is the average level of the students who actually enter these schools?
For two years, DAUR has mapped "attractiveness": the probability that a candidate lucky enough to have a choice prefers school A to school B, as well as the average level of the schools. So where, in the exam hierarchy, does the typical intake of each program stand?
A rigorous, first-of-its-kind methodology
We rebuilt the cross-withdrawals for the main CPGE tracks: MP, MPI, PC, PSI, PT, TSI, BCPST, TB, TPC, ATS Génie Industriel and ATS Génie Civil. In total, 1,649,004 withdrawals were modeled, for 446 possible choices at 185 schools, covering the whole range: engineering schools, veterinary schools, ENS, military schools, etc.
This database was made possible by:
Direct collaboration with many schools and exam boards;
Methodically rebuilding the matrices from public data: admission lists, ranks and enrollment statistics.
The analysis relies on a log-linear model. This model, well known in experimental economics and choice theory, computes relative attractiveness scores from the preferences revealed between pairs of schools. What matters here is not a school's raw selectivity (the subject of a future article), but the fact that a student who can choose between two schools picks one over the other.
From attractiveness score to average admission rank
Going from intention to academic level takes three key steps:
Estimating the probability of registering for each exam: track by track (MP, MPI, PC, etc.), we analyzed the exams to estimate the probability of registering according to the student's rank (modeled by a parameterized function in ln(e(x)+1));
Simulating track by track: we "replay" each exam as if every candidate had registered for every exam. The registration probability of a student of rank is modeled by the function , which smooths out the extremes without erasing the structural elitism of CPGE;
Consensus across tracks: a school has a single standard, whatever the exam. We therefore align the ranks of the last admitted student across tracks (MP ↔ PC ↔ BCPST, etc.) and solve a system of equivalences to arrive at a common scale.
At the end of this two-step process, each program gets an Average Admission Rank: a single number summing up the average position of its admitted students among the 23,188 ranked candidates.
Results
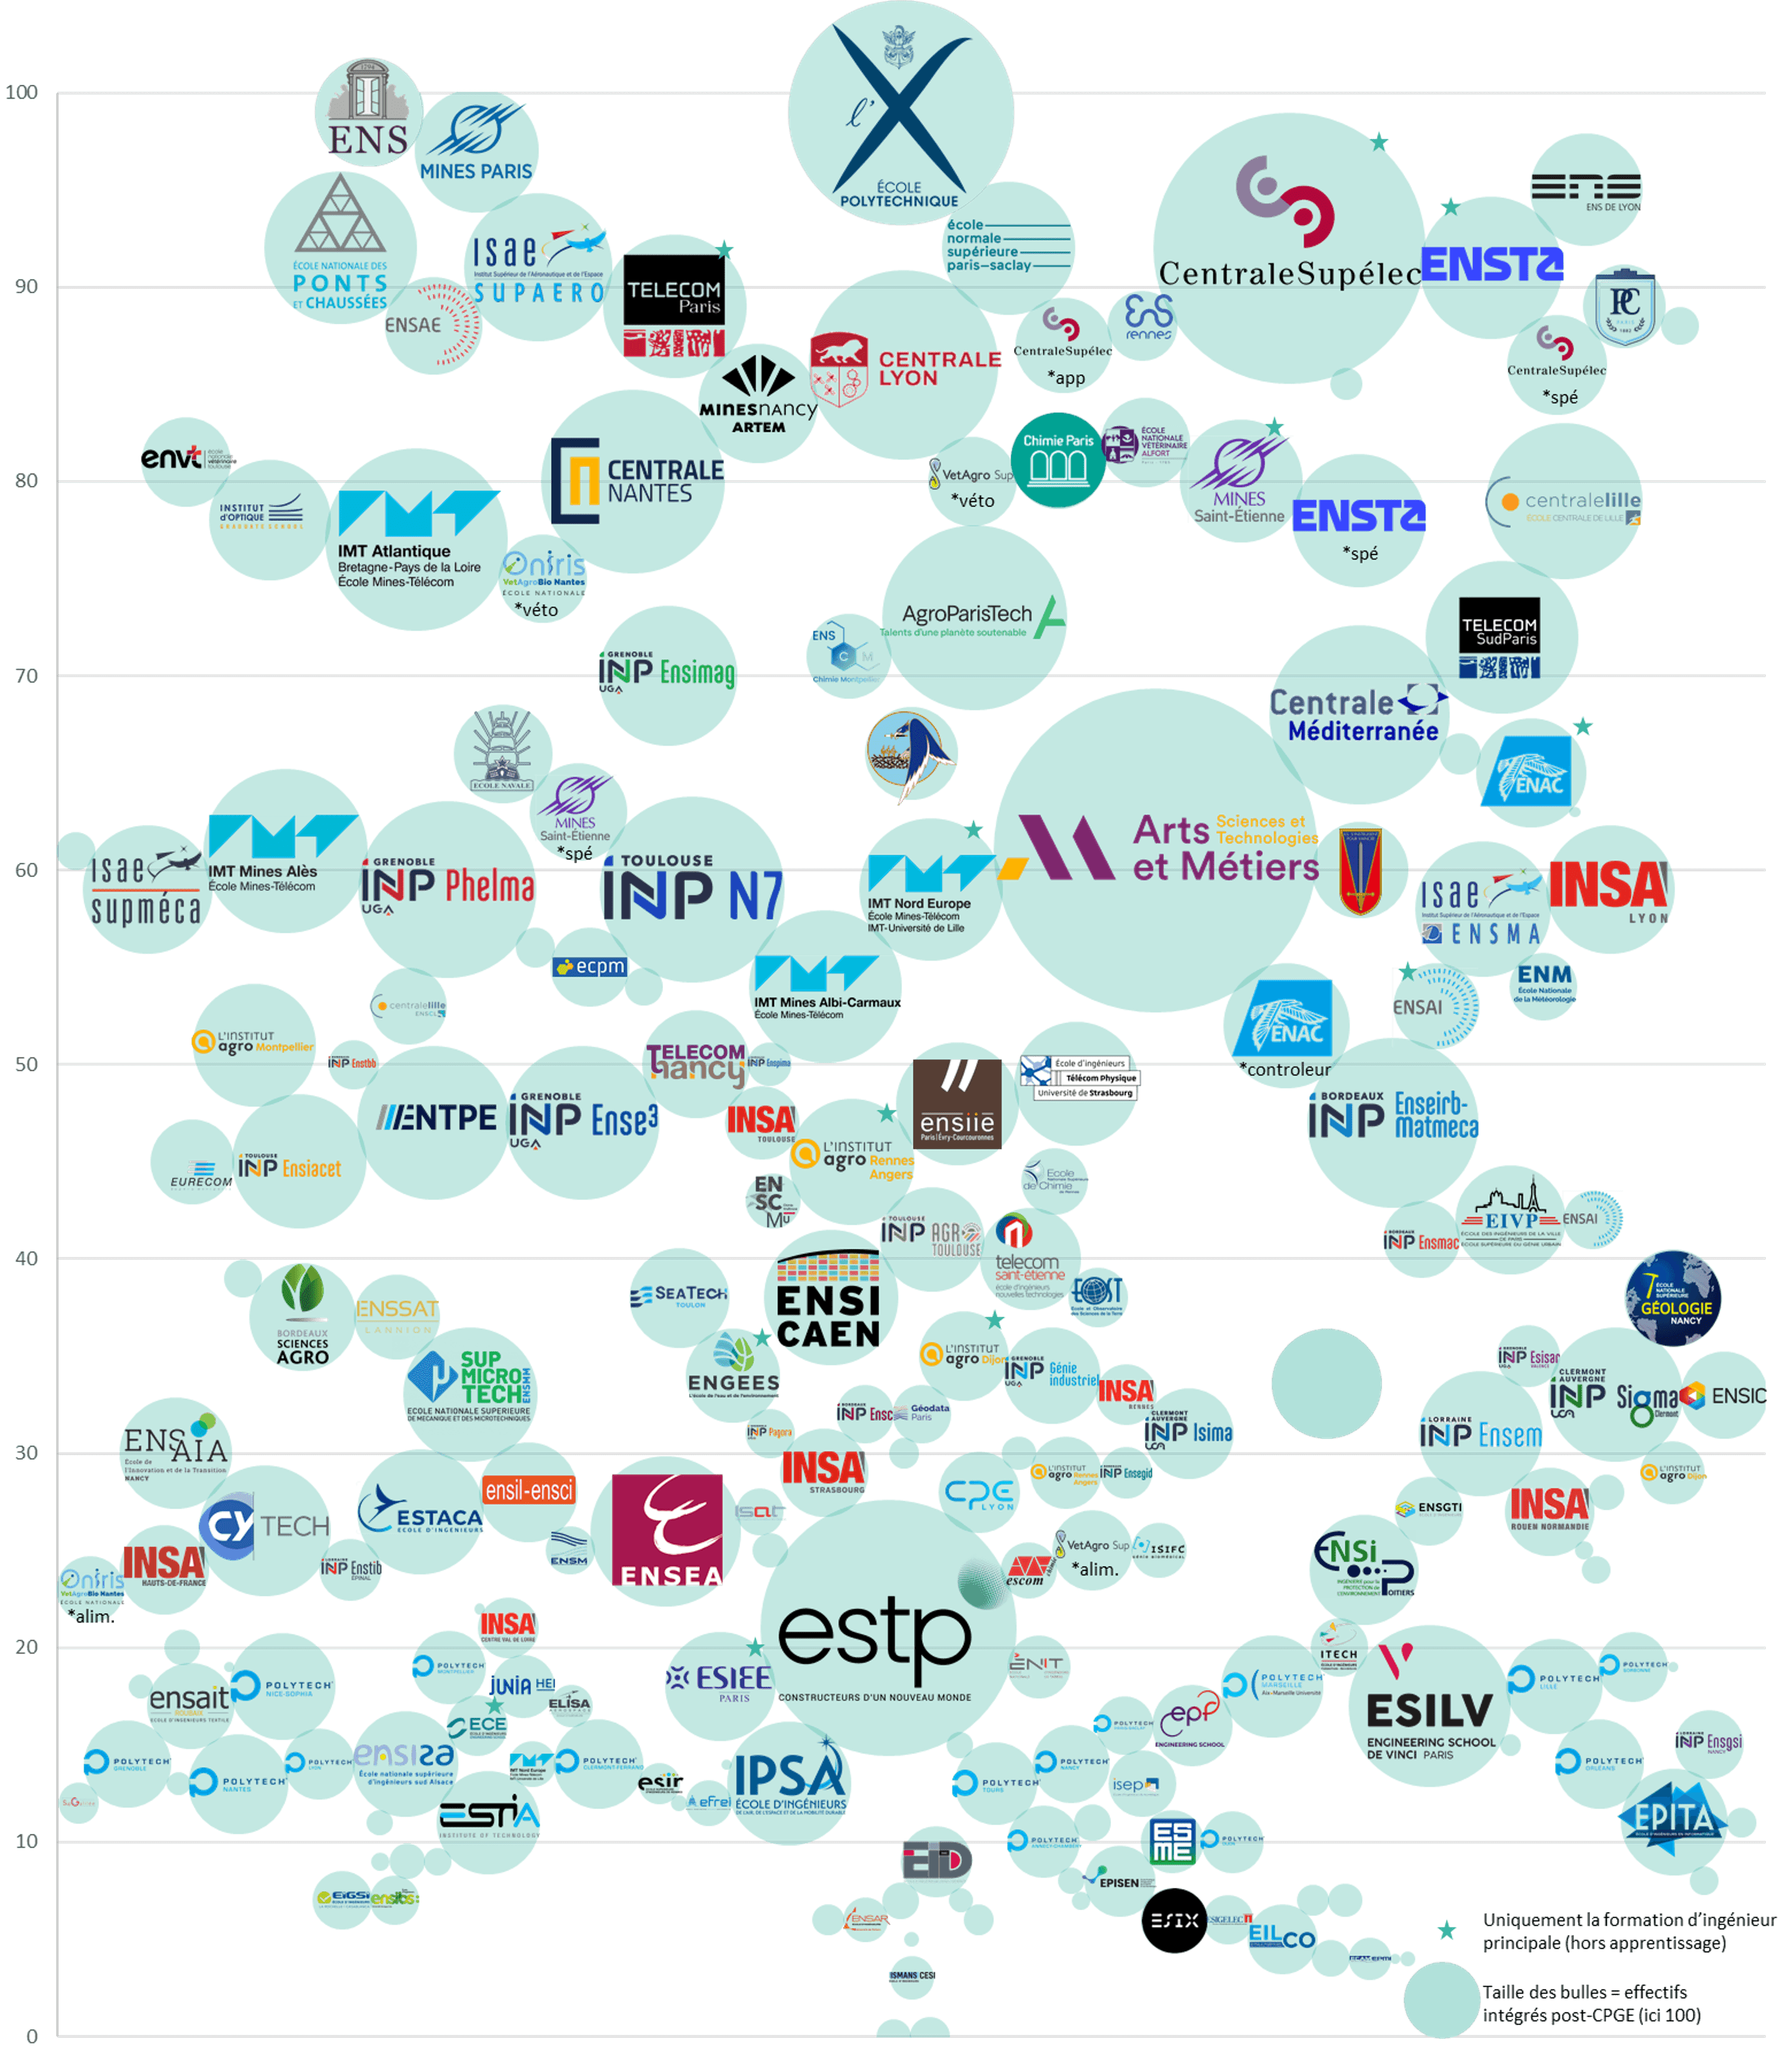
Note : schools admitting fewer than 15 post-CPGE students are not shown. Schools are shown by their main program, excluding specialized programs (such as Mines Saint-Étienne - ISMIN) and apprenticeships (such as CentraleSupélec, ENSTA or ECE); exceptions are marked with an asterisk.
No surprises at the top, but some nuance
No point pretending to be surprised: École polytechnique, Mines Paris and CentraleSupélec, alongside the ENS, sit at the top, followed by the specialized schools Ponts, ENSTA, Supaéro, ESPCI and Télécom. Unlike the attractiveness analysis, however, the average admission rank slopes more gently: going from the X to CentraleSupélec takes "only" a few more ranks, a step where attractiveness suggests a jump.
An apparent linearity runs through this whole "ranking": as soon as the last student admitted to the X is placed, places fill up at Mines, then at Centrale, and so on. The attractiveness gap is large, but the average level rises almost continuously.
Further down, the ranking stays linear; what changes is how spread out the candidates are
Places keep filling in sequence, through the regional Centrales, the IMT schools, the INPs, the Polytechs and so on, in a linear way.
Looking at the dispersion ratio, however:
The closer the ratio is to 1, the more the school's admitted students were not admitted to the school above and the fewer students it lost to schools below. A higher ratio means either that the school takes students who were admitted to better schools and/or loses students to other schools, or that its admission standards differ from one prépa track to another.
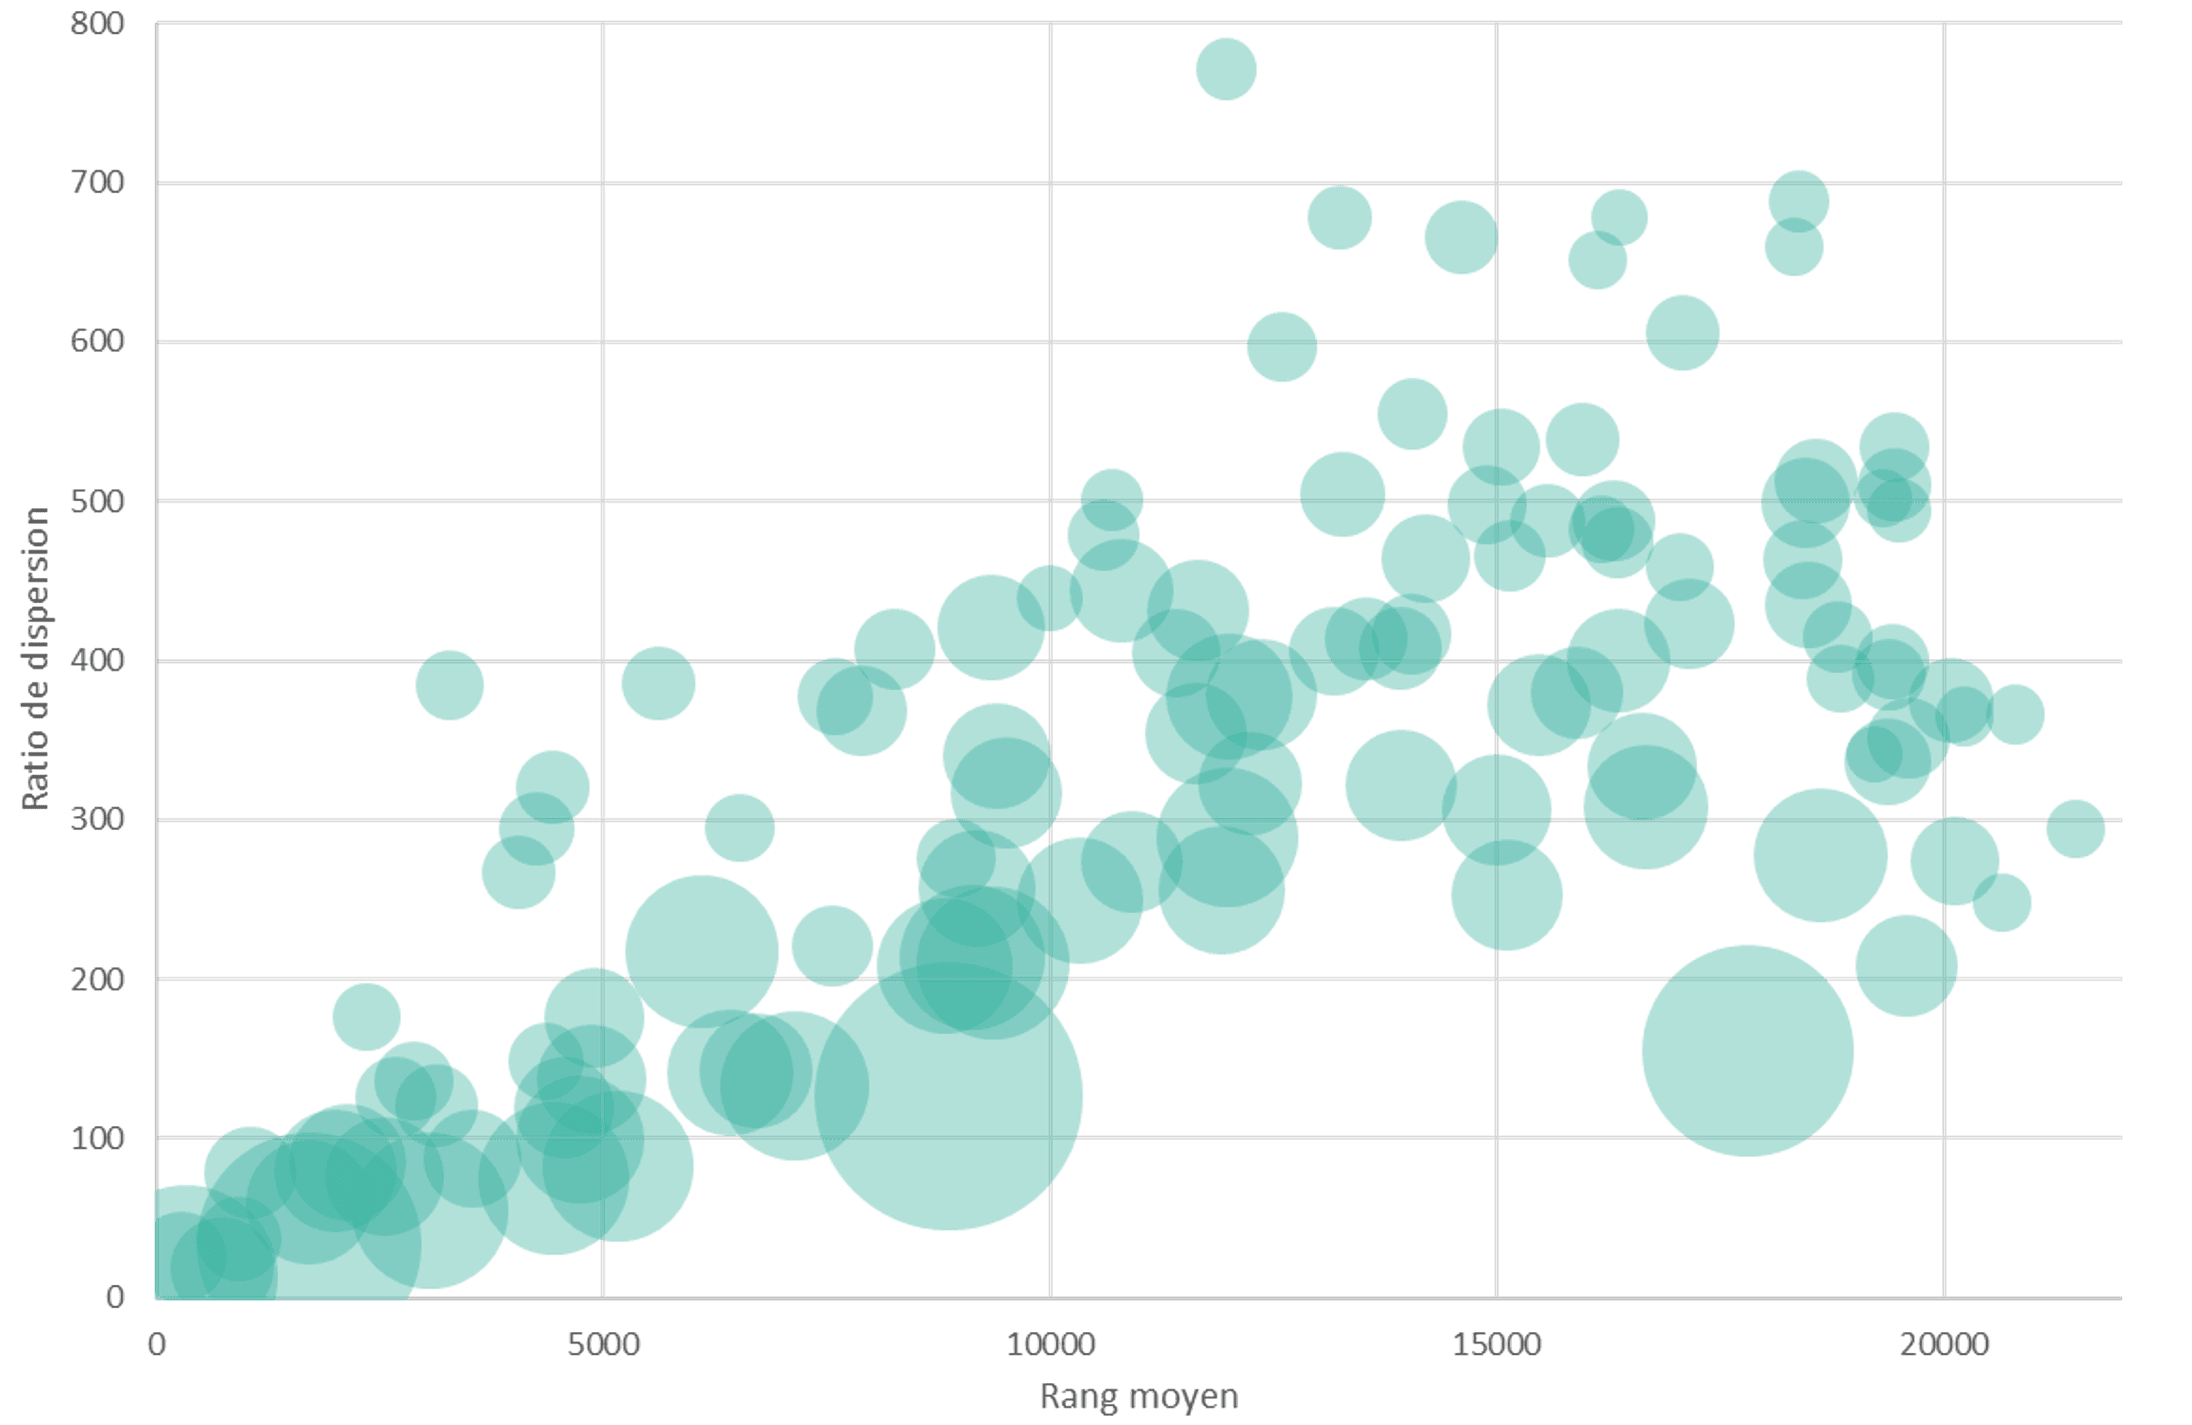
Le ratio de dispersion est défini comme le rapport entre la dispersion relative d'une promotion en termes de rang aux concours et la taille de cette promotion.
On this measure, unlike the average admission rank alone, there is a sharp difference between the top 20 schools and the rest. At the top of the table the ratio is close to 1, while further down the dispersion is much greater. From around rank 17,000 to 18,000, the dispersion ratio drops (or at least levels off) because of an edge effect at the end of the table: there are no admitted students beyond rank 22,000, so intakes are not completely filled and the ratio falls.
Quality of the data used in the study
The full details of the data used and its quality are in the updated article on attractiveness:
https://www.daur-rankings.com/blog/attractivity-engineering-2026