

2026 selectivity of engineering schools open through Parcoursup
An analysis of how deep programs recruited in the 2025 Parcoursup session.
How far down the overall ranking of candidates does each school have to go to fill its intake?
After studying the attractiveness of engineering schools open through Parcoursup, DAUR is publishing a second indicator, devoted to their selectivity.
The two notions complement each other, but they answer different questions. Attractiveness measures the preference revealed when a candidate can choose between several schools. Selectivity describes how deep a school recruits: down to which rank does a program have to go to fill its intake?
A school can therefore be in high demand without recruiting only the best-ranked candidates, especially when it has many places. Conversely, a small program can show a very well-ranked last admitted student without being as attractive as a large national school.
An analysis of 317 programs and 18,643 admitted students
The study uses the same data as our attractiveness analysis: 317 engineering programs at 137 schools or groups of schools, for a total of 18,643 admitted students in the session studied.
Programs of the same school are grouped through the "Group" variable. This makes it possible to publish one indicator per institution while keeping the variety of its specialties, campuses and admission routes.
The scope covers 876,654 applications counted at program level. This is not a number of unique candidates: one student may have applied to several programs and be counted in each of them.
The rank of the last admitted student as a measure of selectivity
For each program f, DAUR rebuilds the rank of the last admitted student in the overall ranking:
where Rs is the overall rank of synthetic student s.
The lower Df is, the less far down the ranking the program has to go to fill its intake, and the more selective it is considered. A high rank means the program recruits deeper into the ranked population.
This measure differs from a simple admission rate. An admission rate depends heavily on the number of applications received, including applications that were unlikely to succeed. The rank of the last admitted student focuses on where the recruitment cutoff actually falls in a common ranking.
A weighted average to compare schools
A school can offer several programs of very different sizes and selectivity. The selectivity rank of school e is computed as an average weighted by the number of admitted students:
where:
Df is the rank of the last admitted student in program f;
nf is the number of students admitted to that program;
De is the school's weighted average rank of the last admitted student.
This weighting gives more weight to the programs that make up most of the intake. It also limits the influence of a very small program whose last admitted student could be unusual.
The raw rank is then turned into an easier-to-read indicator. Since a low rank means high selectivity, the scale is reversed:
A score close to 100 therefore means the tightest recruitment, and a score close to 0 the schools that go furthest down the overall ranking to fill their intakes.
The score is a linear normalization, not a percentile. A school scoring 80 is not necessarily among the 20% most selective. Likewise, a ten-point gap does not mean that one school is "10% more selective" than another.
The bounds Dmin and Dmax are set on the model's full scope (including CPGE, veterinary schools, architecture schools, etc.), and the chart is then filtered on engineering groups. The school at the top of the chart can therefore score slightly below 100.
Unlike the Bradley-Terry attractiveness score, the gap between two selectivity scores cannot be turned into a probability of preference. Both indicators use a 0 to 100 scale to make them easier to read, but their statistical meaning differs.
Results
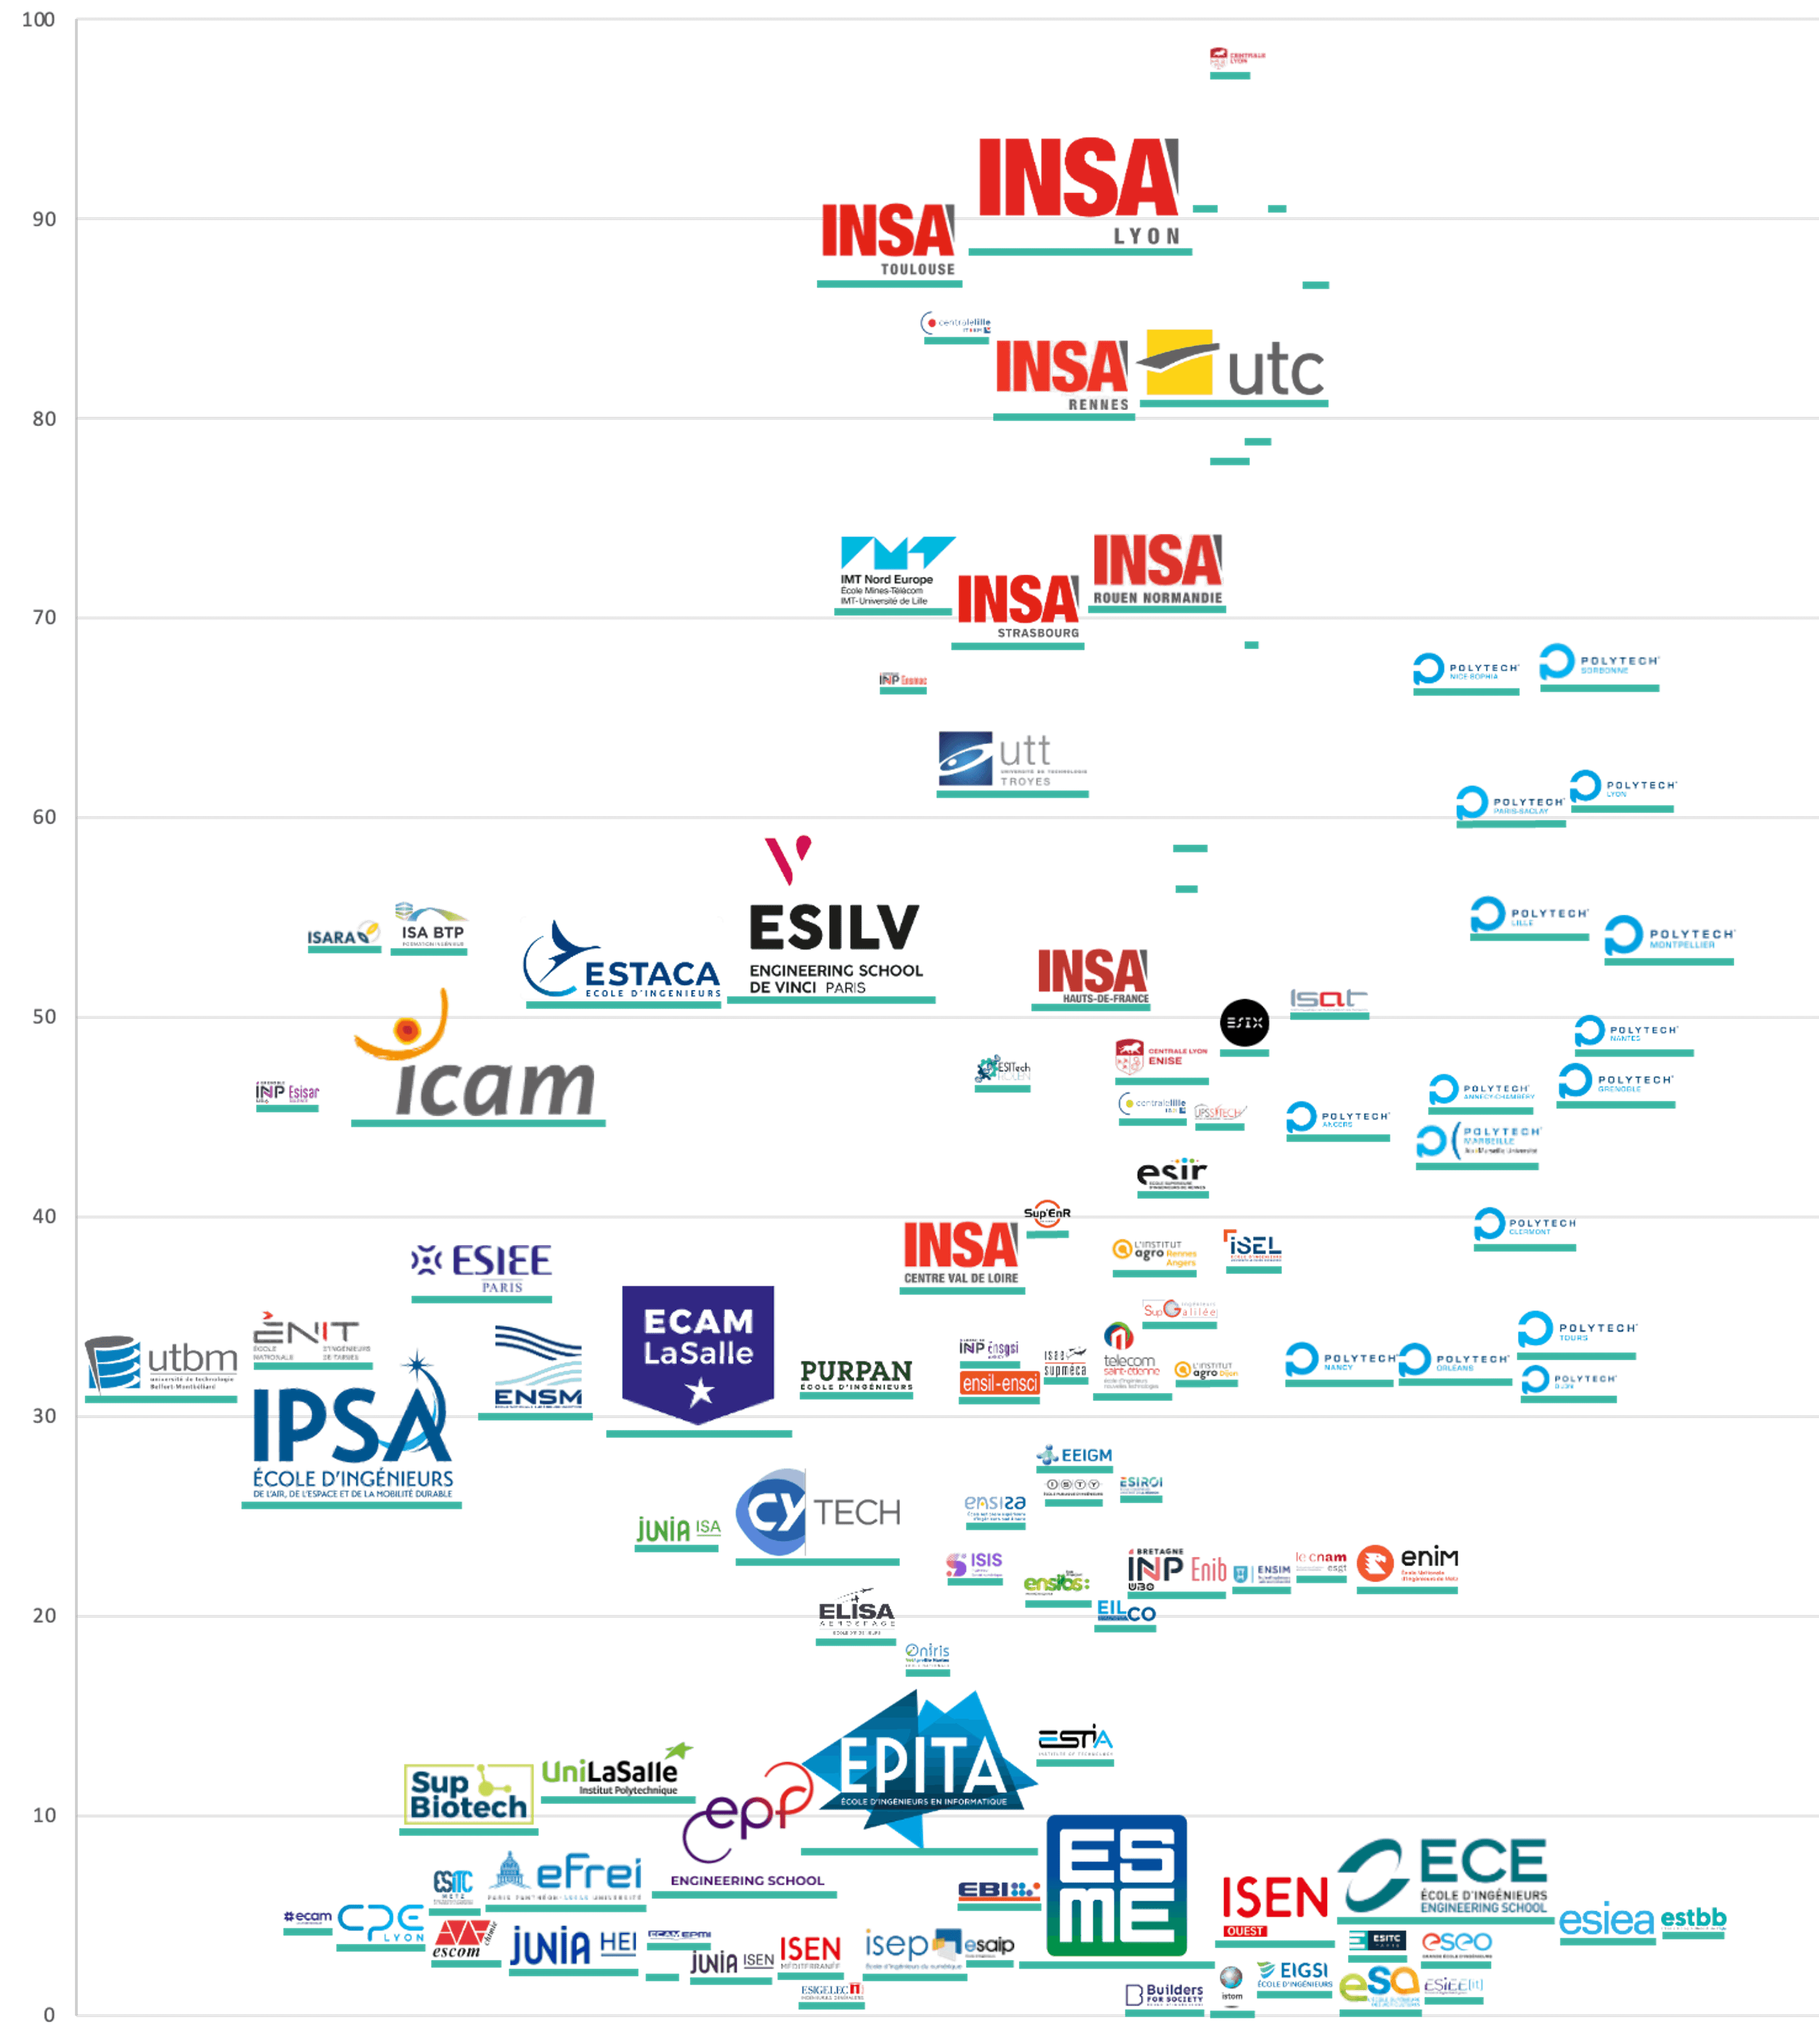
How to read it: the higher a school sits, the more selective its recruitment. The horizontal position carries no information and only keeps the logos readable. The turquoise lines show the height of the score. Data: 2025 Parcoursup session.
The INSA schools remain the most selective
The INSA group is especially present at the top of the chart. INSA Lyon scores close to 89 and INSA Toulouse around 87. INSA Rennes is also among the most selective schools, close to 80.
UTC also sits around 81. Further down, INSA Rouen Normandie and IMT Nord Europe are around 70, while INSA Strasbourg stays just below that mark.
Some schools that recruit mainly after CPGE have also opened very selective post-bac programs with few places, such as Centrale Lyon with Cap'ECL and the Bordeaux INP schools with CPBx
These results show that several public post-bac programs can admit large intakes while keeping a high recruitment cutoff.
Wide gaps within the same networks
Selectivity varies more within networks than attractiveness does.
The INSA schools hold very different positions: Lyon and Toulouse are in the first group, Rennes, Rouen and Strasbourg form an upper-middle tier, while INSA Centre Val de Loire sits in the lower middle of the chart.
The spread is also visible among the universities of technology and the Polytech schools. It can be explained by location, number of places, specialization, the age of the school or the makeup of its applicant pool.
Selectivity and intake size
Selectivity depends on both demand and the number of places. With comparable attractiveness, a school recruiting 700 students has to go further down the ranking than a program with 30 places.
The score should therefore not be read as a pure measure of prestige or quality. It describes an observed balance between the level of the candidates, their enrollment decisions and the school's capacity.
This explains why some small programs appear very high on the chart. Their score can be statistically sound, but it rests on a small number of admitted students and can vary more from year to year.