
2026 attractiveness of engineering schools open through Parcoursup
An analysis of the preferences revealed in the 2025 Parcoursup session.
Which engineering schools do high school students actually choose when they can enter several programs?
Every year, French engineering schools do much of their recruiting through Parcoursup, especially the so-called post-bac schools, for which it brings in most of their future students, who commit to five years of study. Parcoursup publishes part of the admissions data, including selectivity and enrollment rates. When a student who could enter several programs ends up joining one of them, that choice says something about their relative attractiveness.
At DAUR, we used this logic to compare the engineering schools open through Parcoursup. The aim is not to measure how hard admission is, the academic level of the intakes or the academic quality of the programs. The question is a different one: at a comparable level, and when there is a choice, which school is preferred most often?
An analysis at school level
The data covers 317 engineering programs, linked to 137 schools or groups of schools through a common classification. Of these, 293 programs have at least one admitted student and feed directly into the estimate. In total, the scope represents 876,654 applications counted at program level (the same candidate can appear in several programs) and 18,643 enrollments.
Grouping by school is essential. One institution can offer several specialties, campuses or admission routes. All the programs of a group are combined before the final estimate. Comparisons between two programs of the same school are excluded: they should not count as the school beating itself.
Preferences rebuilt from admissions and enrollments
The available data is aggregated. It does not list, candidate by candidate, every offer received and the final choice. The analysis therefore rebuilds a synthetic population of admitted students and a consistent overall ranking from the modeled admission and enrollment rates.
For each program i, we estimate an admission threshold p(i). Synthetic students ranked above that threshold who enrolled in another program count as revealed preferences for their school. These observations are then added up in a pairwise comparison matrix.
For two schools i and j, this gives a number of "wins" of i over j and of j over i. The comparison network of the full model links 570 groups and covers all 162,165 possible pairs. The chart shown here keeps only the 137 engineering groups open through Parcoursup.
The Bradley-Terry model
Attractiveness is estimated with a Bradley-Terry model. Each school i has a latent parameter θi. The probability that school i is preferred to school j is:
The model is fitted by maximum likelihood on all the comparisons. The parameters are then centered, since only their differences can be identified.
The values θi, hard to read directly, are turned into a score from 0 to 100:
This score keeps the model's gaps: it is not a percentile. A score of 80 means neither that the school wins 80% of its comparisons nor that it automatically belongs to the top 20%.
In the calibration used here, a 5-point gap corresponds to a probability of preference of about 73%, and a 10-point gap to a probability close to 88%.
The 0 to 100 scale is computed on all 570 groups of the model, and the chart is then filtered on engineering schools only. That is why the top school on this chart scores 88.4 and not 100.
Results
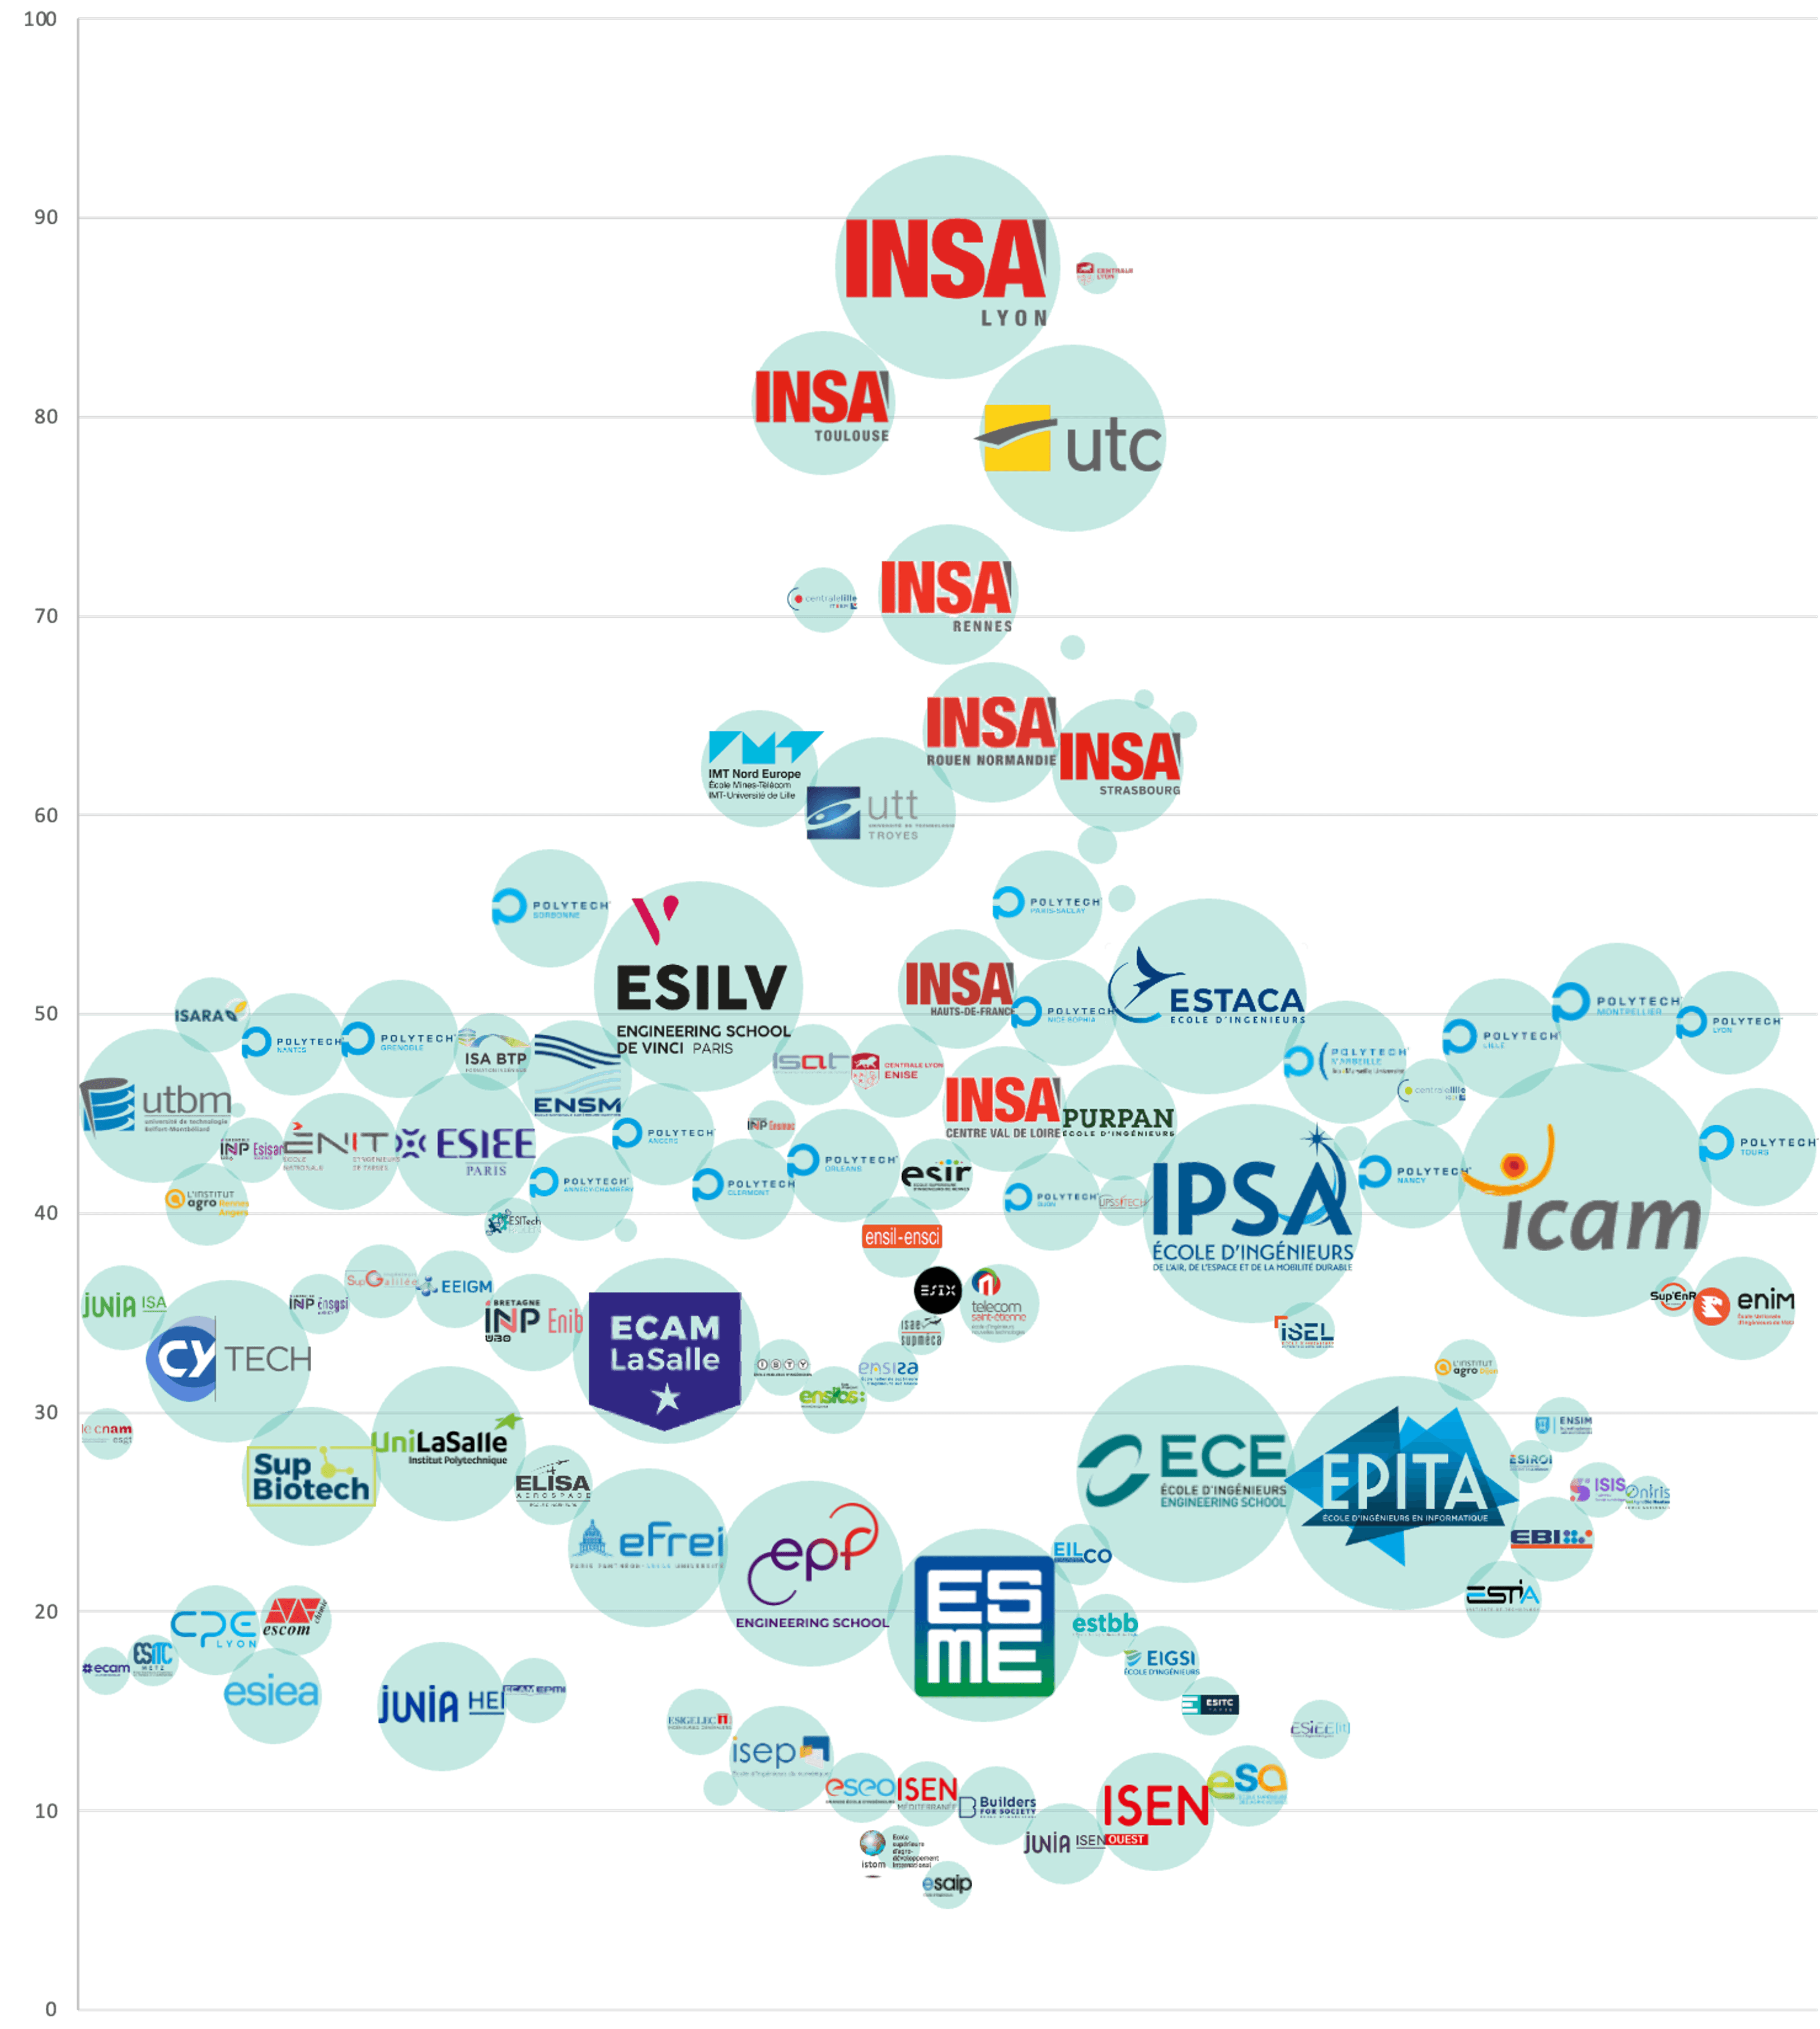
Illustration complète de l'attractivité des écoles d'ingénieurs post-bac 2026 (session 2025), les écoles de moins de 25 intégrées n'ont pas leur logo sur le graphique.
How to read it: only the vertical position shows attractiveness. The horizontal axis carries no information and only spaces out the bubbles. Bubble size is the number of students admitted to the school's programs. Data: 2025 Parcoursup session.
National networks form fairly uniform blocks
The chart shows large gaps between schools of the same network, but these gaps stay within one "zone" of the chart.
All the INSA schools are in the top half of the table (especially the 5 oldest, which sit at the top): INSA Lyon scores 88.4, INSA Toulouse 82.1, INSA Rennes 72.8, INSA Rouen Normandie 66.1, INSA Strasbourg 64.4, INSA Hauts-de-France 52.8 and INSA Centre Val de Loire 46.4. The universities of technology come next: UTC reaches 80.9, UTT 62.1, UTBM 46.6 and UTTOP 44.2. The Polytech schools are packed very tightly, with 16 schools within 7 points either side of 47.
Belonging to a network creates a shared identity, but it does not erase the effect of location or of a program's specialization on candidates.
A tightly packed middle of the ranking
The middle of the chart is much denser than the top. 48 of the 137 groups, about 35%, score between 40 and 60. The median score is 38.4. In this zone, a few points are not enough to set a firm order. Choices may depend more on the field of specialization, distance from home, cost, work-study options, campus life or how well candidates knew the school when they made their choices.
This density is also a reminder that rank order greatly simplifies the information. Two schools a few places apart can be almost equally attractive, while a large score gap reflects a more meaningful difference in preference.
Attractiveness and intake size measure different things
Bubble size shows the number of admitted students, but it plays no part in the vertical reading. A school with a large intake can have a middling score, while a small program can score high.
The score reflects relative preference. Intake size also depends on the number of places, the number of programs in the group and the recruitment strategy. A bigger bubble does not mean a more attractive school.
Another way to look at post-bac choices
Attractiveness adds information that admission rates alone cannot give. Selectivity shows how deep a program recruits. Average level describes the academic profile of those who join it. Attractiveness tries to identify the preferred option when several are open.
These three dimensions should be read together. Combined, they show where a school stands in candidates' choices without reducing orientation to a single ranking.